Claude Code AI Observability installation
Contents
- 1
Prerequisites
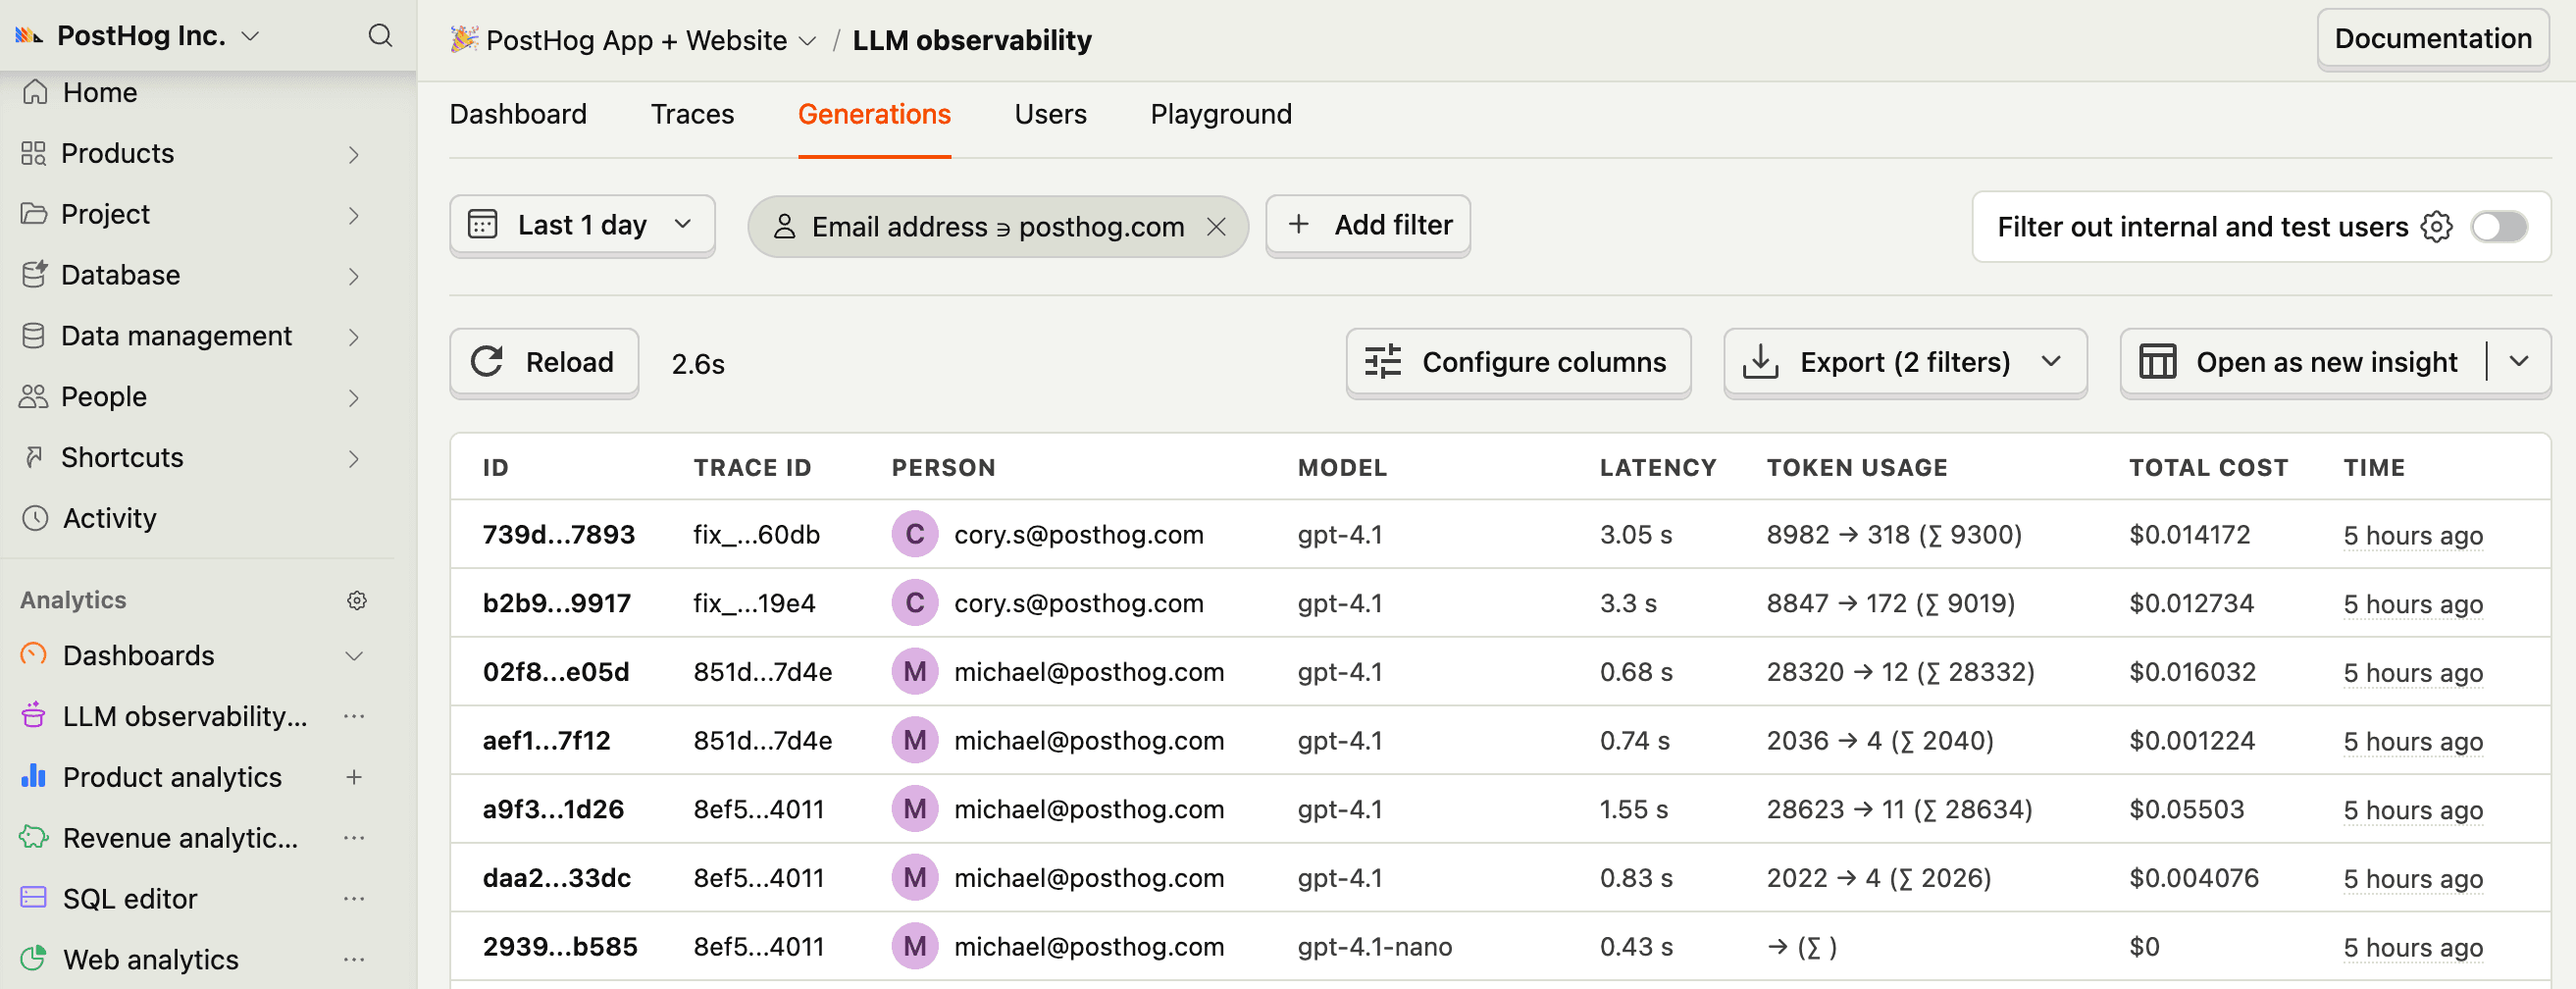
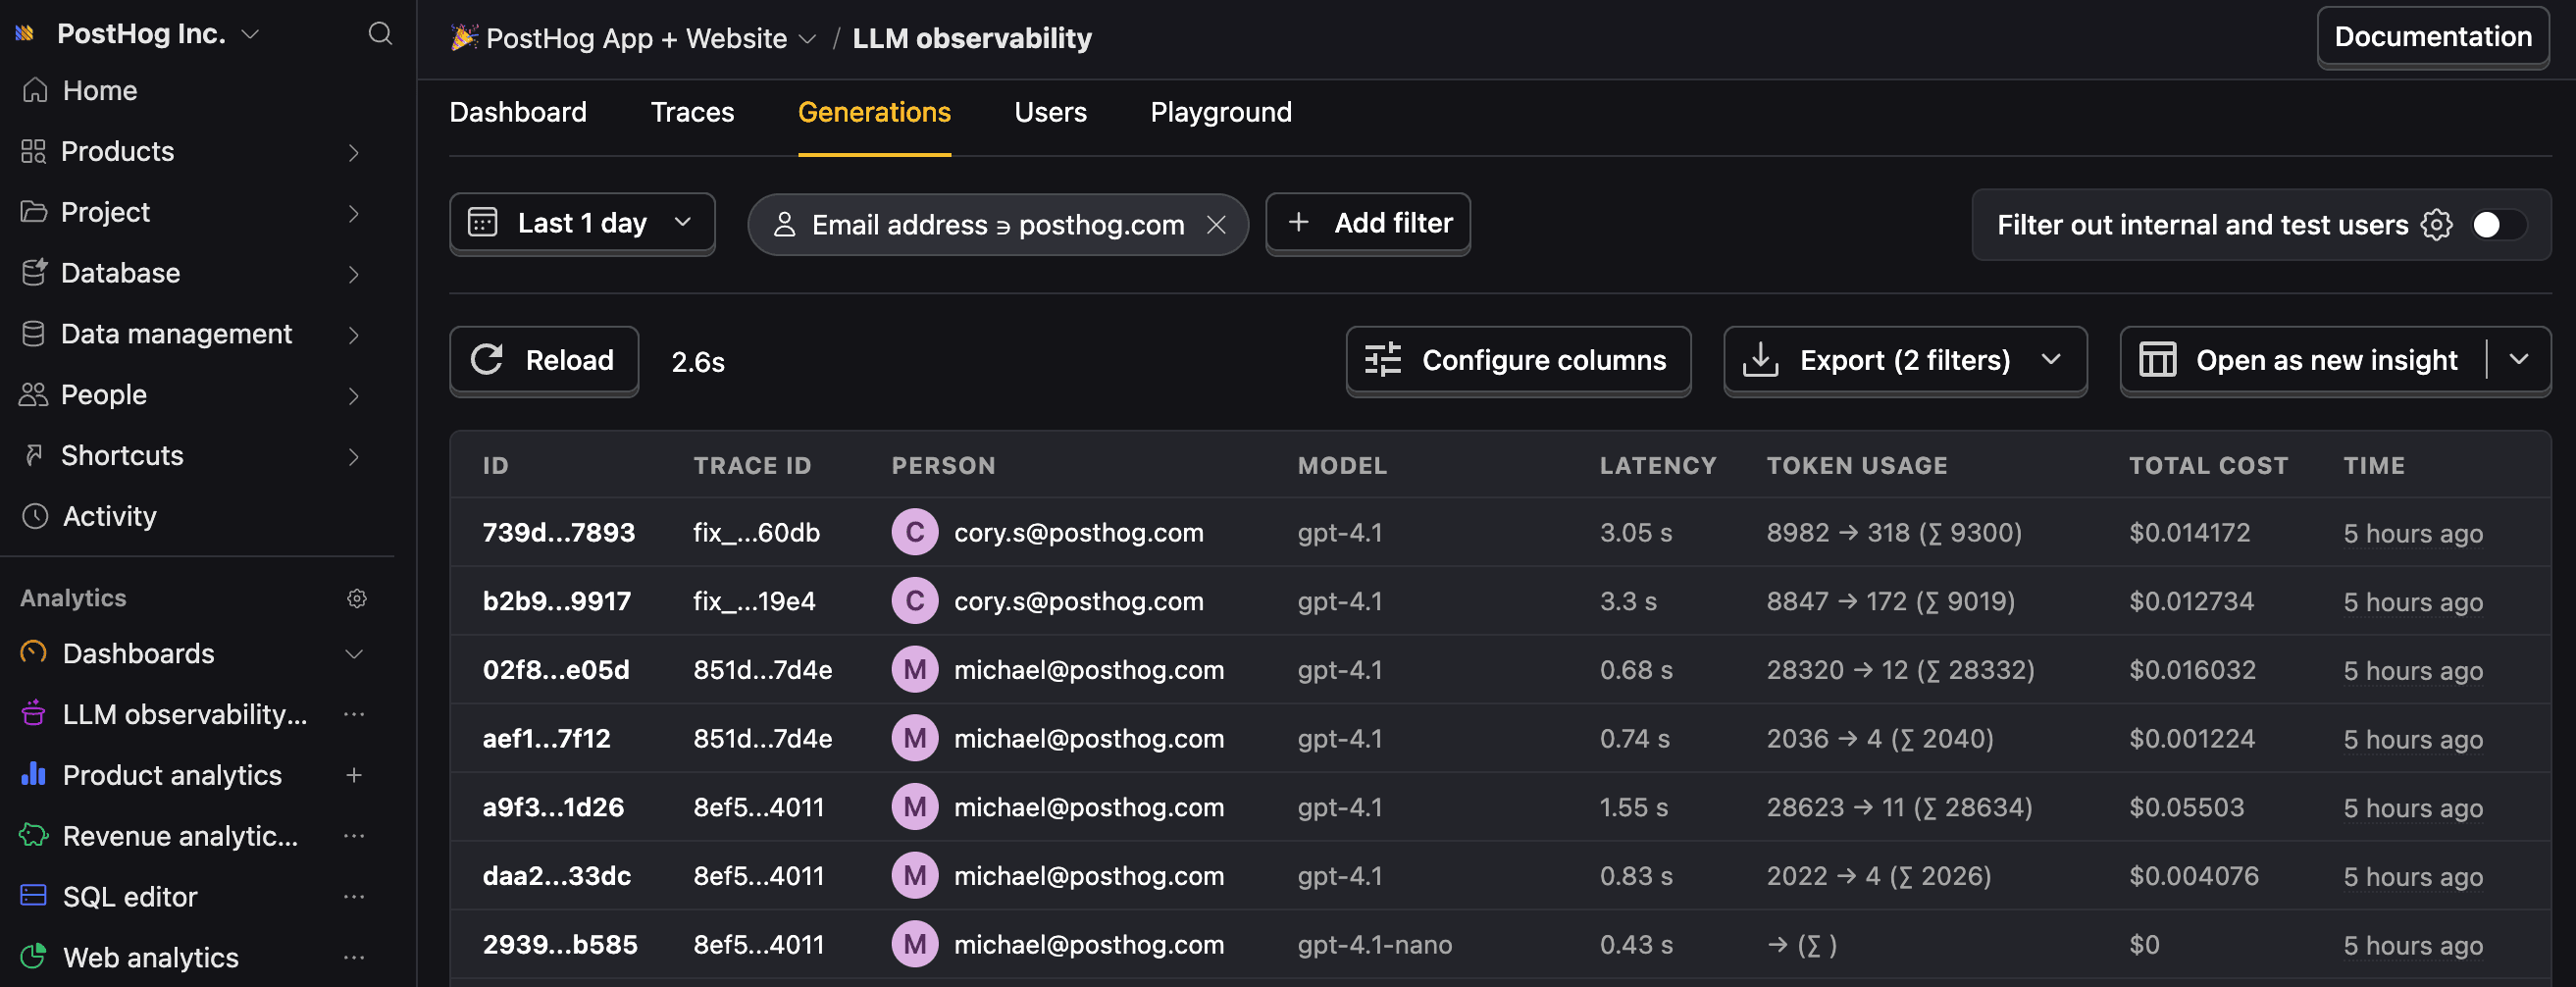
RequiredClaude Code is Anthropic's agentic coding tool that runs in your terminal. The PostHog plugin captures every Claude Code session as structured AI Observability events: generations, tool executions, and traces.
This is useful for:
- Transparency and auditability: See what Claude did in each session, including every tool call and LLM invocation.
- Cost tracking: Monitor token usage and costs across your team.
- Team sharing: Give your team visibility into coding sessions without sharing terminal access.
- Debugging: Trace through multi-step agent runs to understand what happened.
You need:
- Claude Code installed
- A PostHog account with a project token
- 2
Install the PostHog plugin
RequiredInstall the PostHog plugin for Claude Code:
This adds a
SessionEndhook that parses your session logs and sends events to PostHog when each session finishes. - 3
Configure PostHog
RequiredSet environment variables with your PostHog project token and enable the integration. You can find your project token in your PostHog project settings.
Tip: Add these variables to your shell profile, such as
~/.zshrcor~/.bashrc, so they persist across sessions.Alternatively, configure them in your Claude Code settings file (
~/.claude/settings.jsonor.claude/settings.local.json):If you use PostHog EU, set the host as well:
- 4
Run a session
RequiredStart Claude Code as normal and use it for a task:
When the session ends, the plugin parses the session log file and sends events to PostHog. No changes to your workflow are needed.
You can check the status of the last send from within Claude Code:
- 5
Configuration options
OptionalAll configuration is done with environment variables:
Variable Default Description POSTHOG_API_KEY(required) Your PostHog project token POSTHOG_LLMA_CC_ENABLEDfalseSet to trueto enable the integrationPOSTHOG_HOSThttps://us.i.posthog.comPostHog ingestion host POSTHOG_LLMA_PRIVACY_MODEfalseWhen true, LLM input and output content is not sent to PostHog. Token counts, costs, latency, and model metadata are still captured.POSTHOG_LLMA_DISTINCT_IDgit user email Distinct ID for events. Falls back to claude-code:{session_id}if no git email is found.POSTHOG_LLMA_TRACE_GROUPINGsessionsession: one trace per Claude Code session.message: one trace per user prompt.POSTHOG_LLMA_MAX_ATTRIBUTE_LENGTH12000Maximum character length for serialized tool input and output attributes Trace grouping modes
session(default): All generations and tool executions within a Claude Code session are grouped into one trace. Use this to understand complete coding sessions.message: Each user prompt creates a separate trace. Multiple LLM turns within one prompt, including tool-use loops, are grouped under the same trace. Use this to analyze individual interactions.
Privacy mode
When
POSTHOG_LLMA_PRIVACY_MODE=true, all LLM input and output content, user prompts, tool inputs, and tool outputs are redacted. Token counts, costs, latency, and model metadata are still captured without exposing code or conversations.Ingest past sessions
To send data from Claude Code sessions that happened before you installed the plugin, use the ingestion command below.
What gets captured
The plugin captures three types of events:
$ai_generation: Each LLM call, including model, provider, token usage (input, output, cache read, and cache creation), stop reason, and input and output messages in OpenAI chat format.$ai_span: Each tool execution (Bash, Read, Write, Edit, Grep, Glob, MCP tools, and others), including tool name, input parameters, output result, duration, and error information. Learn more about spans.$ai_trace: Completed sessions or prompts, depending on grouping mode, with aggregated token totals and latency. Learn more about traces.
- 6
Next steps
RecommendedNow that you're capturing AI conversations, continue with the resources below to learn what else AI Observability enables within the PostHog platform.
Resource Description Basics Learn the basics of how LLM calls become events in PostHog. Generations Read about the $ai_generationevent and its properties.Traces Explore the trace hierarchy and how to use it to debug LLM calls. Spans Review spans and their role in representing individual operations. Anaylze LLM performance Learn how to create dashboards to analyze LLM performance.